Covid Dashboard
The Covid-19 Dashboard has been one of my pet projects for a while. I started building this in April of 2020 but never really put it out there by the end of 2020 I realised that while there are dashboards, it would be a great learning experience to finish it and share it with the world.
While I had deployed the app previously, I couldnt keep it around since Heroku eliminated free tier servers.
Here are some screen shots -
This dashboard was designed using Plotly Dash. You can find the documentation for the Plotly Dash here: https://dash.plotly.com/
The dashboard uses two main multiple data sources. I have mentioned them in the references of the dashboard but I ll state them here again.
Data Sources
- Main states data from: COVID Tracking project: https://covidtracking.com/data
- County data from John Hopkins COVID database: https://github.com/CSSEGISandData/COVID-19/tree/master/csse_covid_19_data
- List of Geographic State Centers CSV: https://developers.google.com/public-data/docs/canonical/states_csv
The first two sources are the main two data sources for covid data. The national level data is pulled from the covid tracking project and the county level data is pull from John Hopkins dataset.
I also needed the state centers in-order to plot the choropleth maps which I pulled from Google developers site although there are many sources for this data.
This dashboard itself is divided into multiple pages:
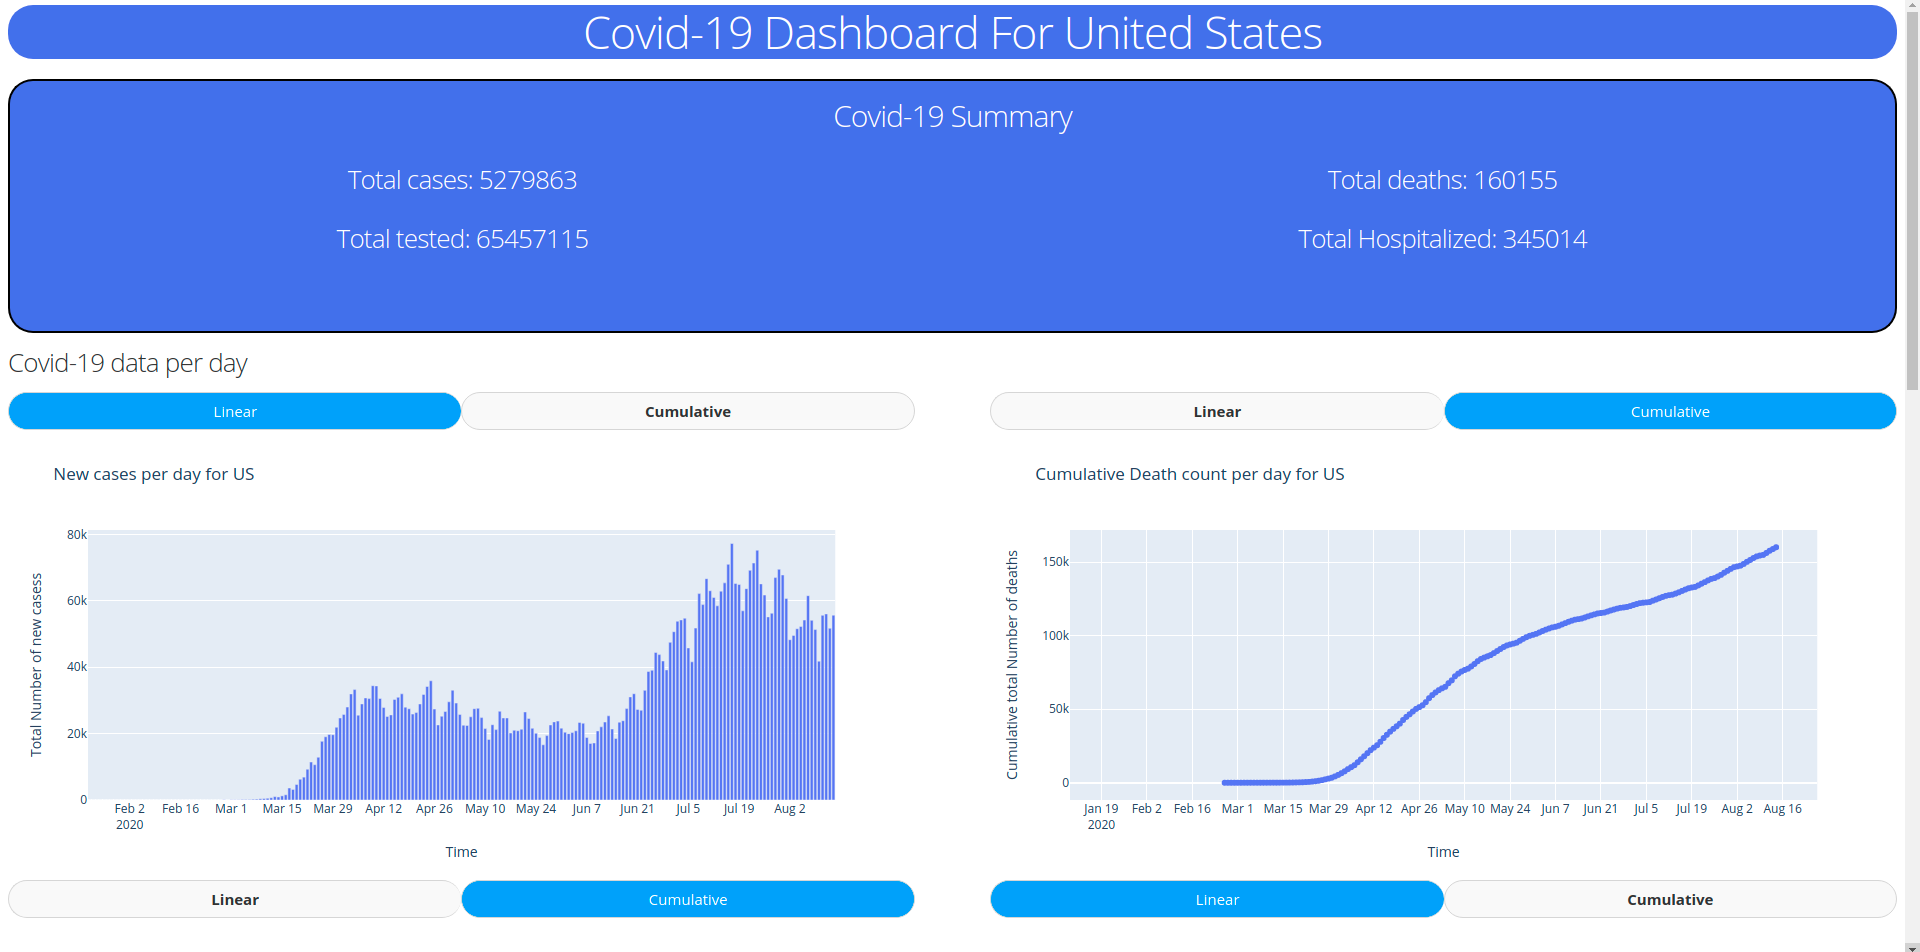
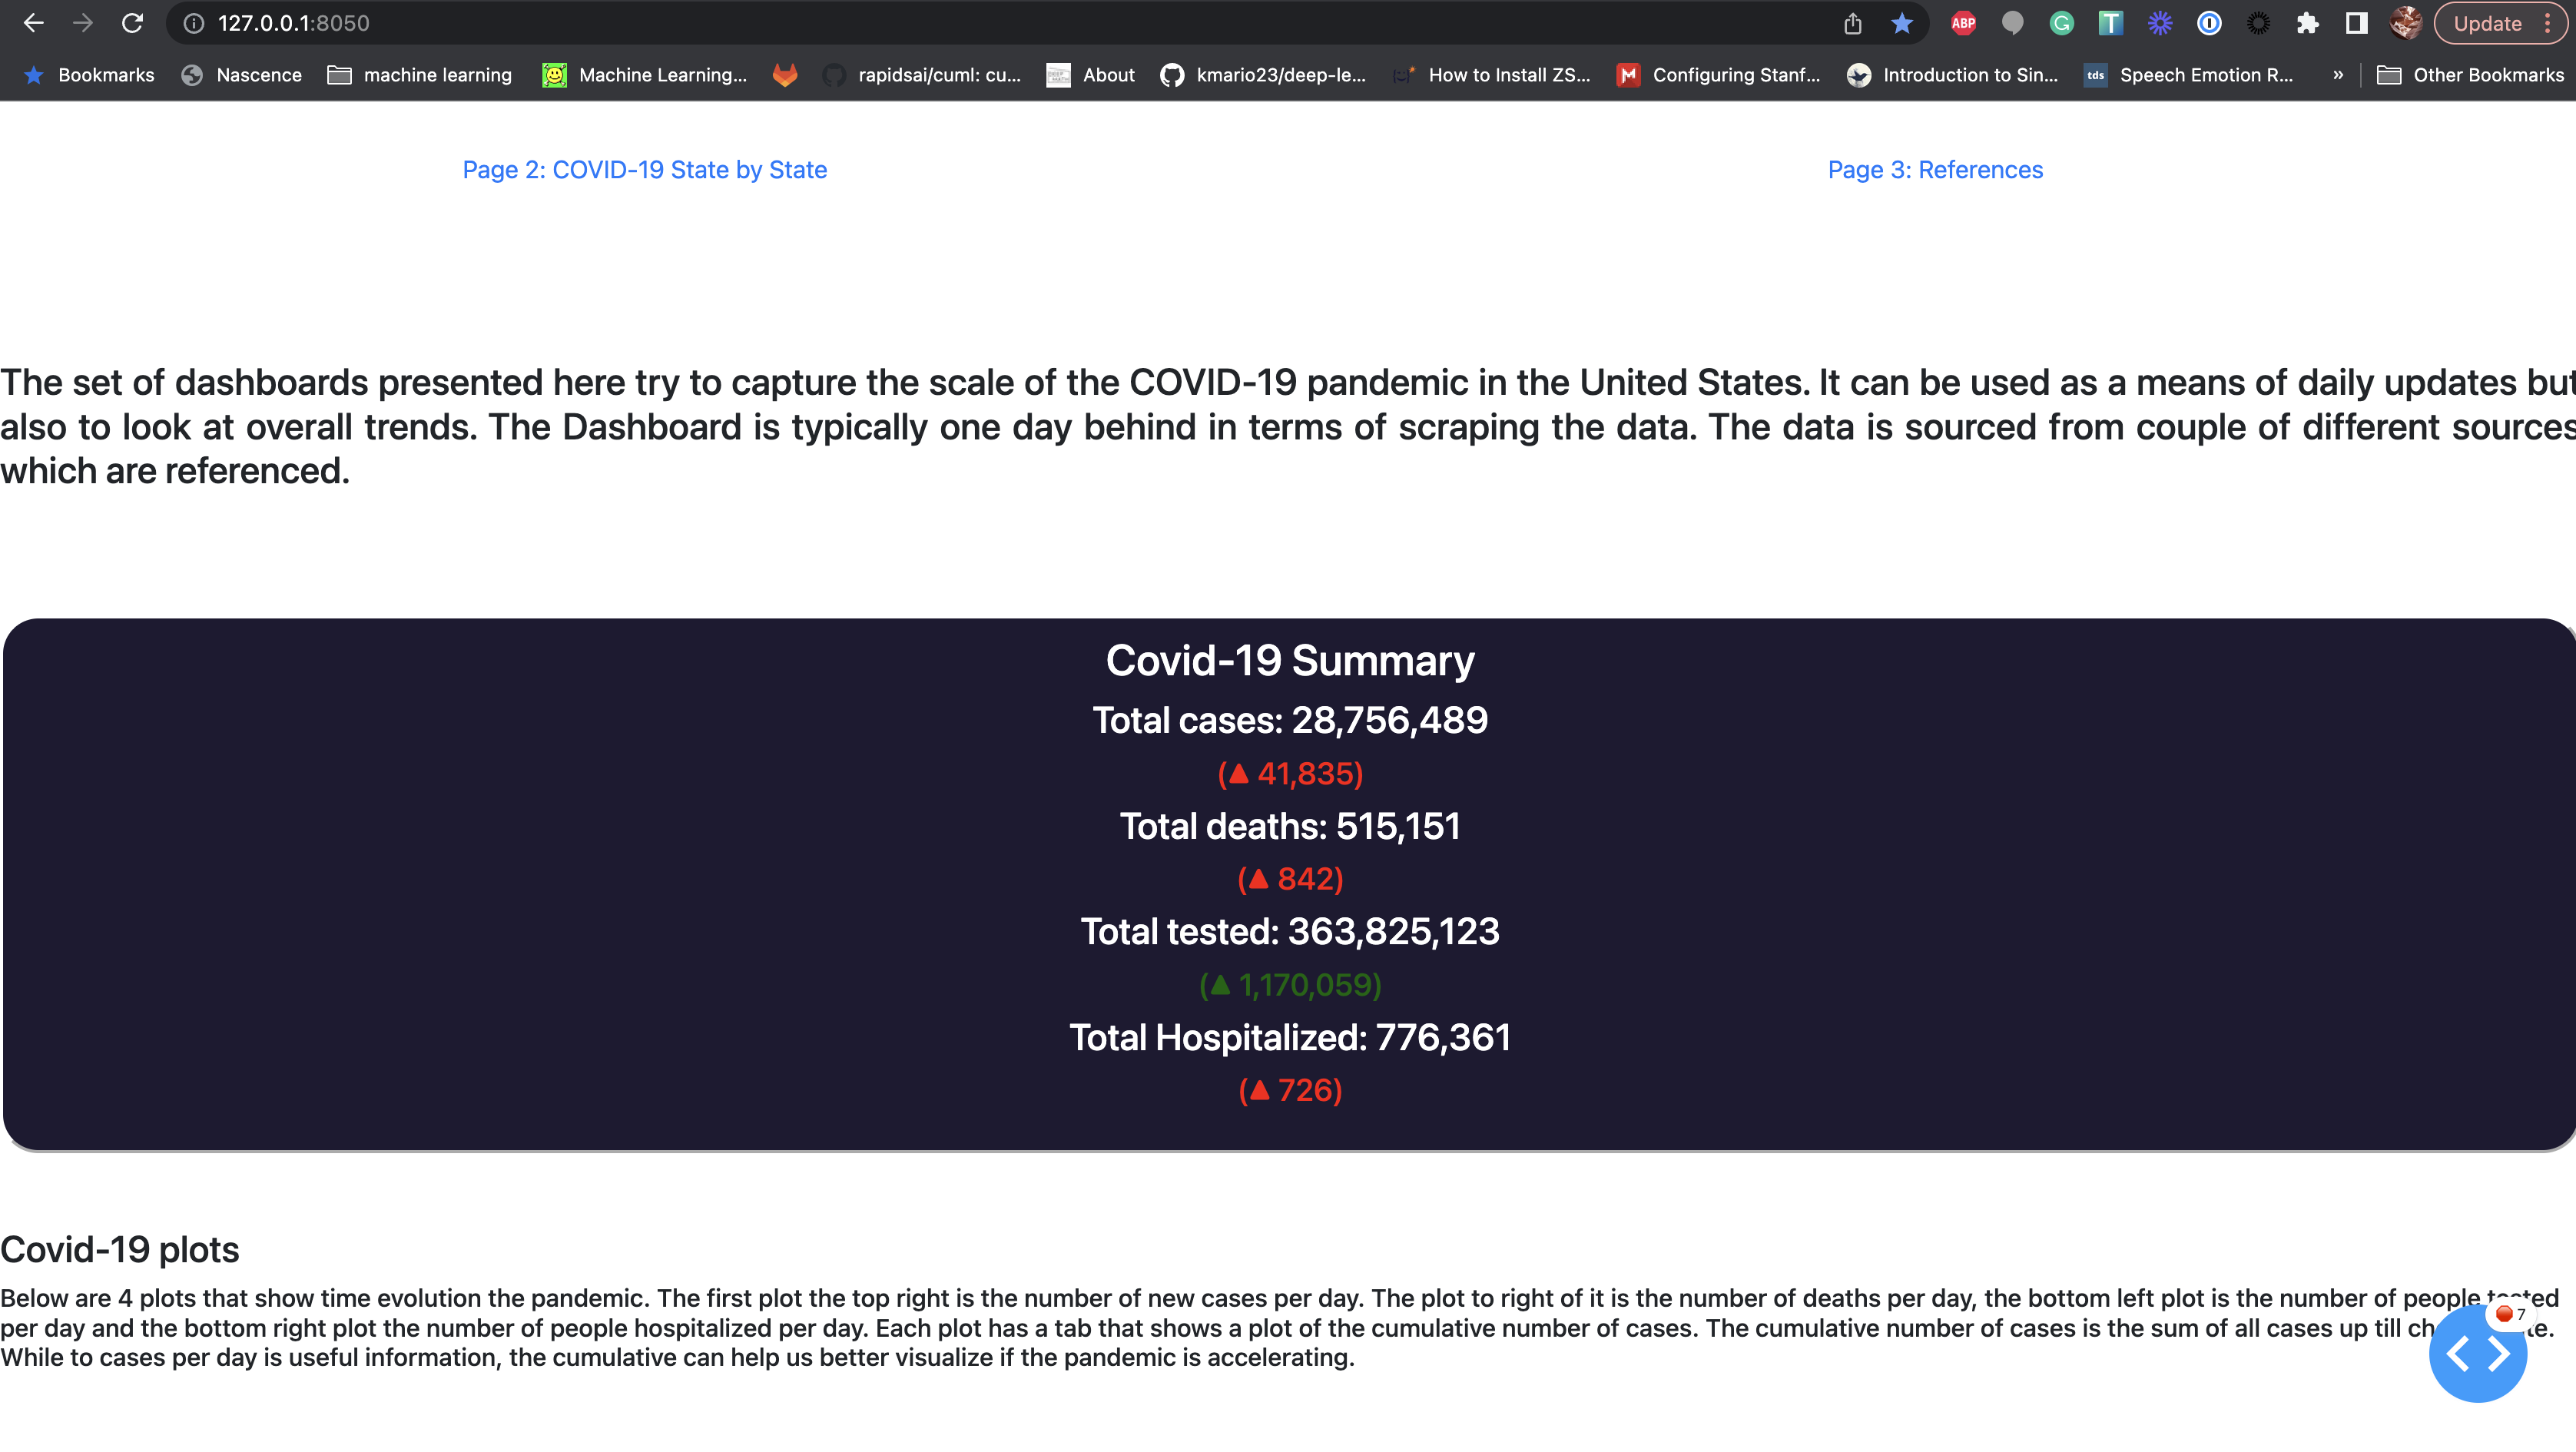
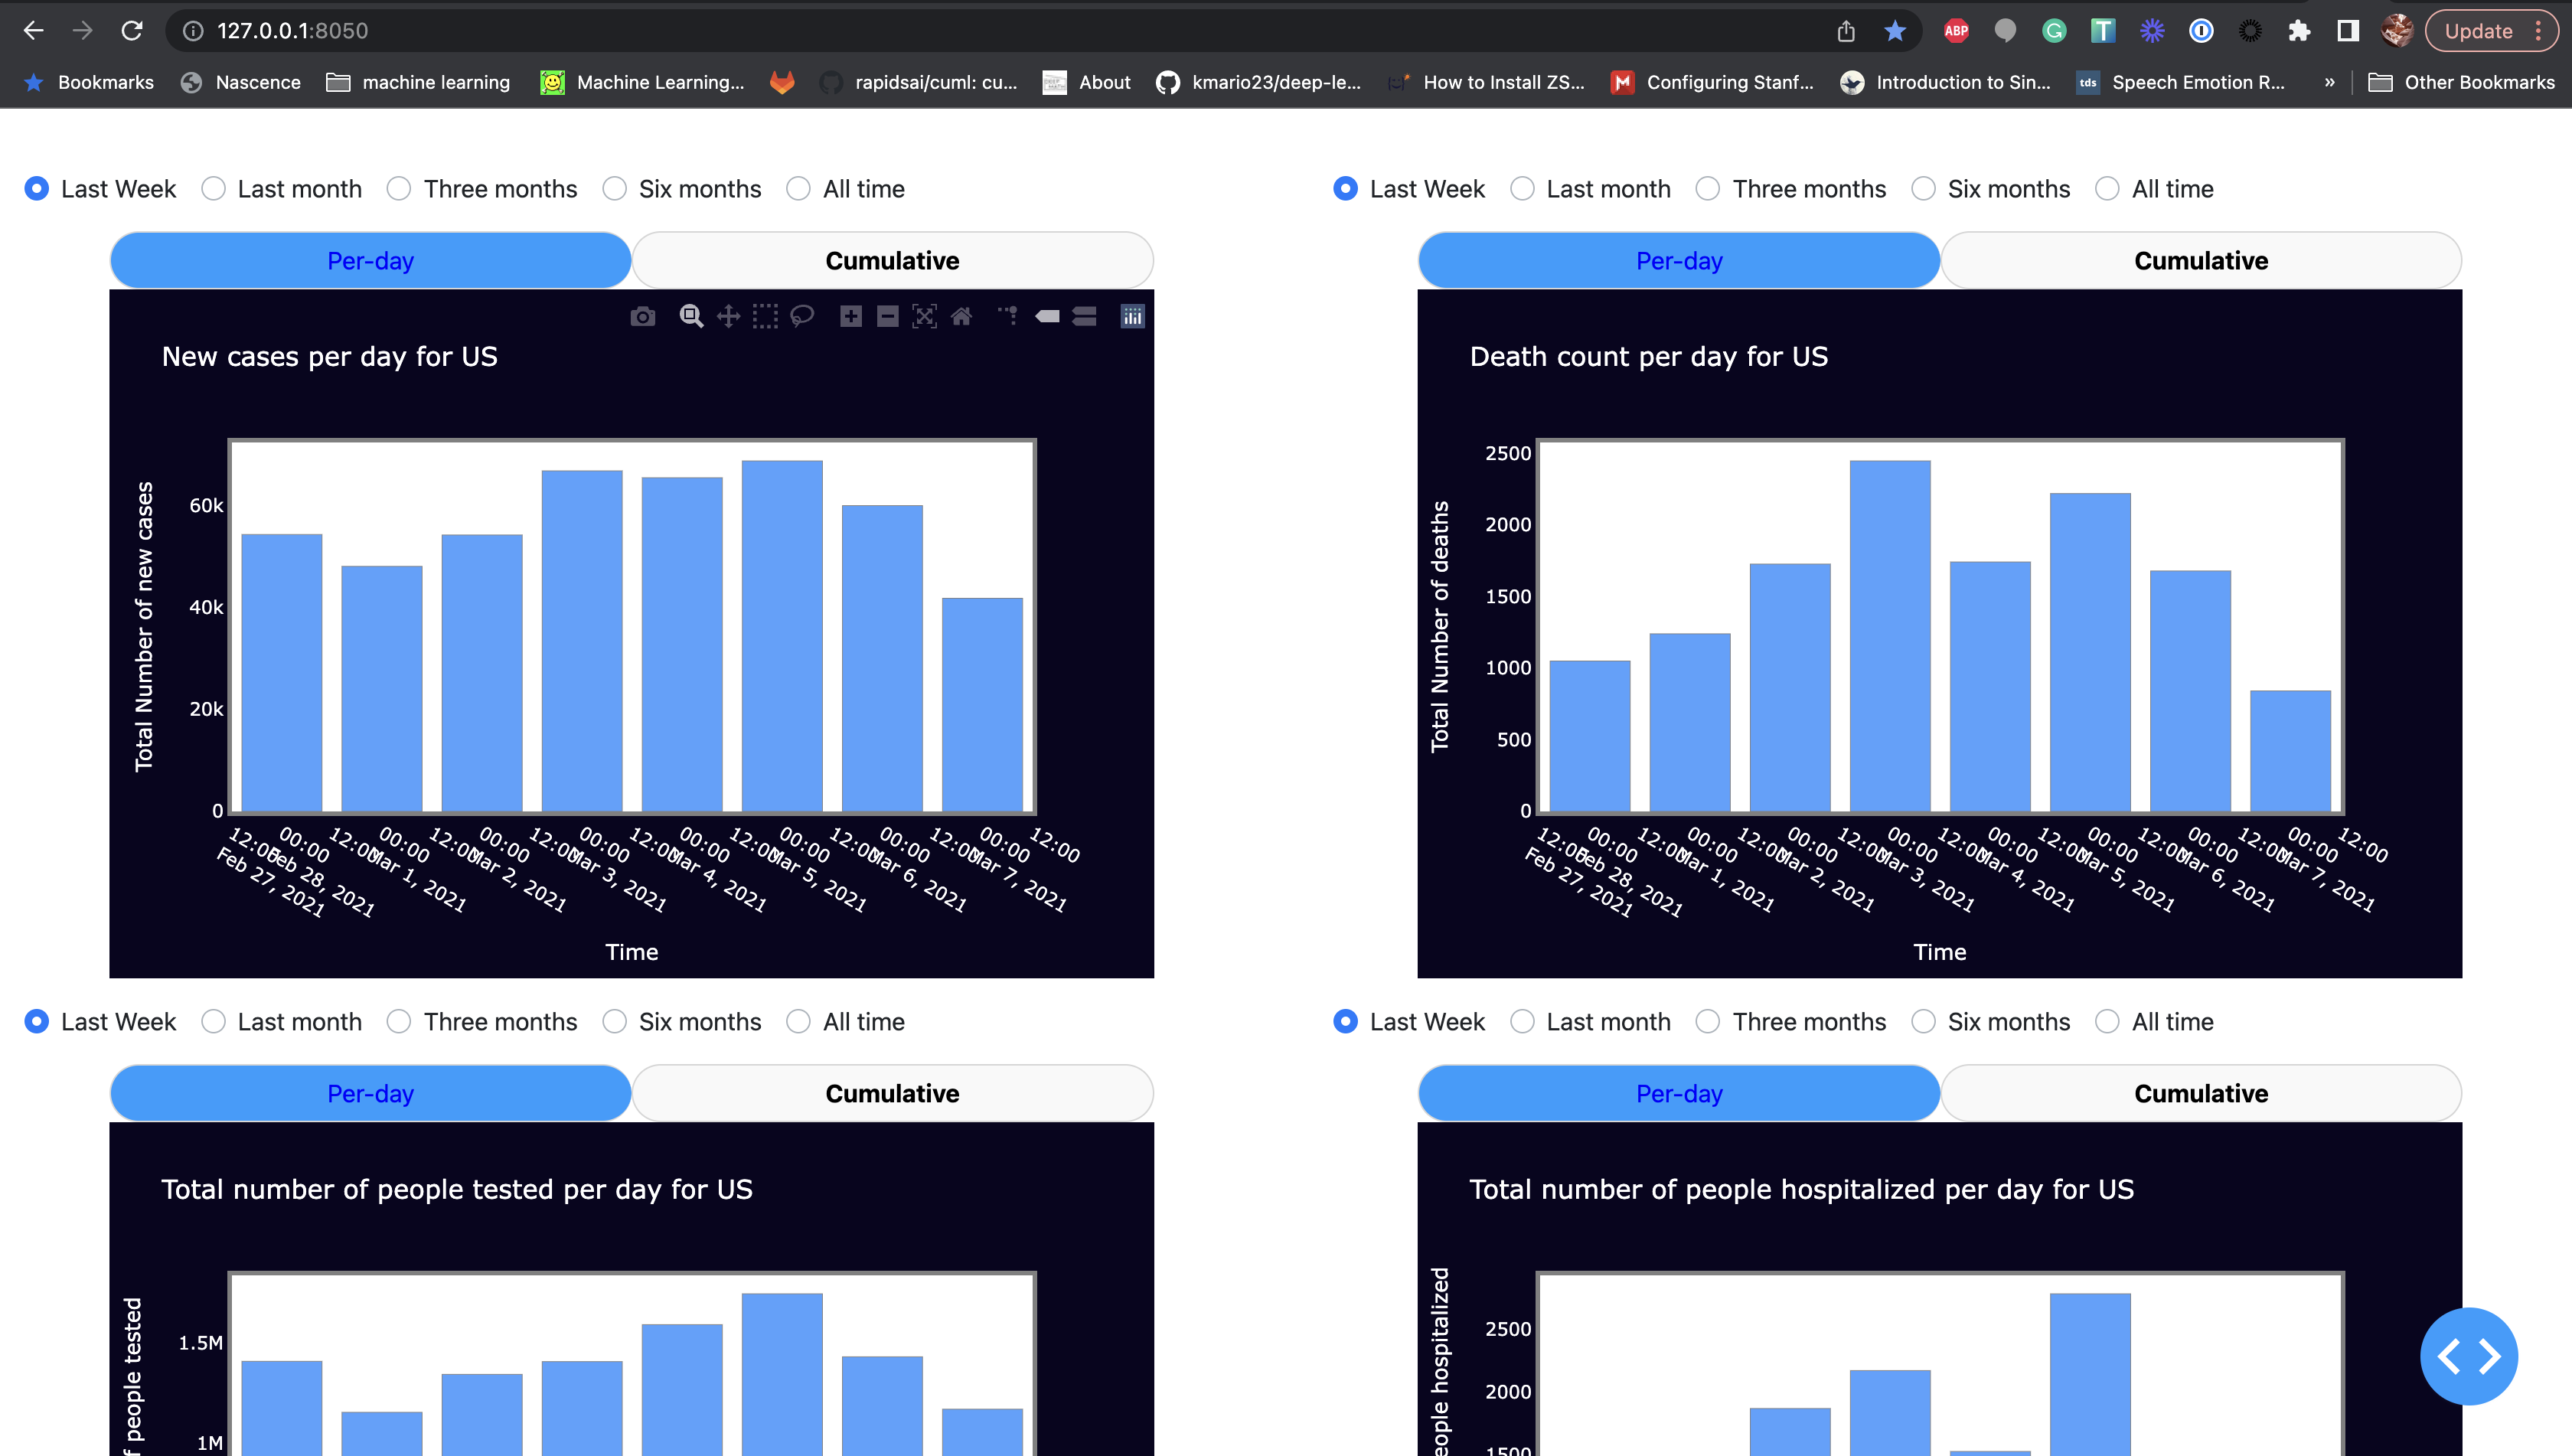
1) The first page gives an overview of the number of cases in the US. It mentions to total number of cases, deaths, people tested and hospitalizations for covid. The red and the green number represent the daily increase. It also contains four plots for each metric with a culumulative plot in an adjacent tab. You can choose to filter the data based on five different time scales: Last week, last month, three months, six months and all time
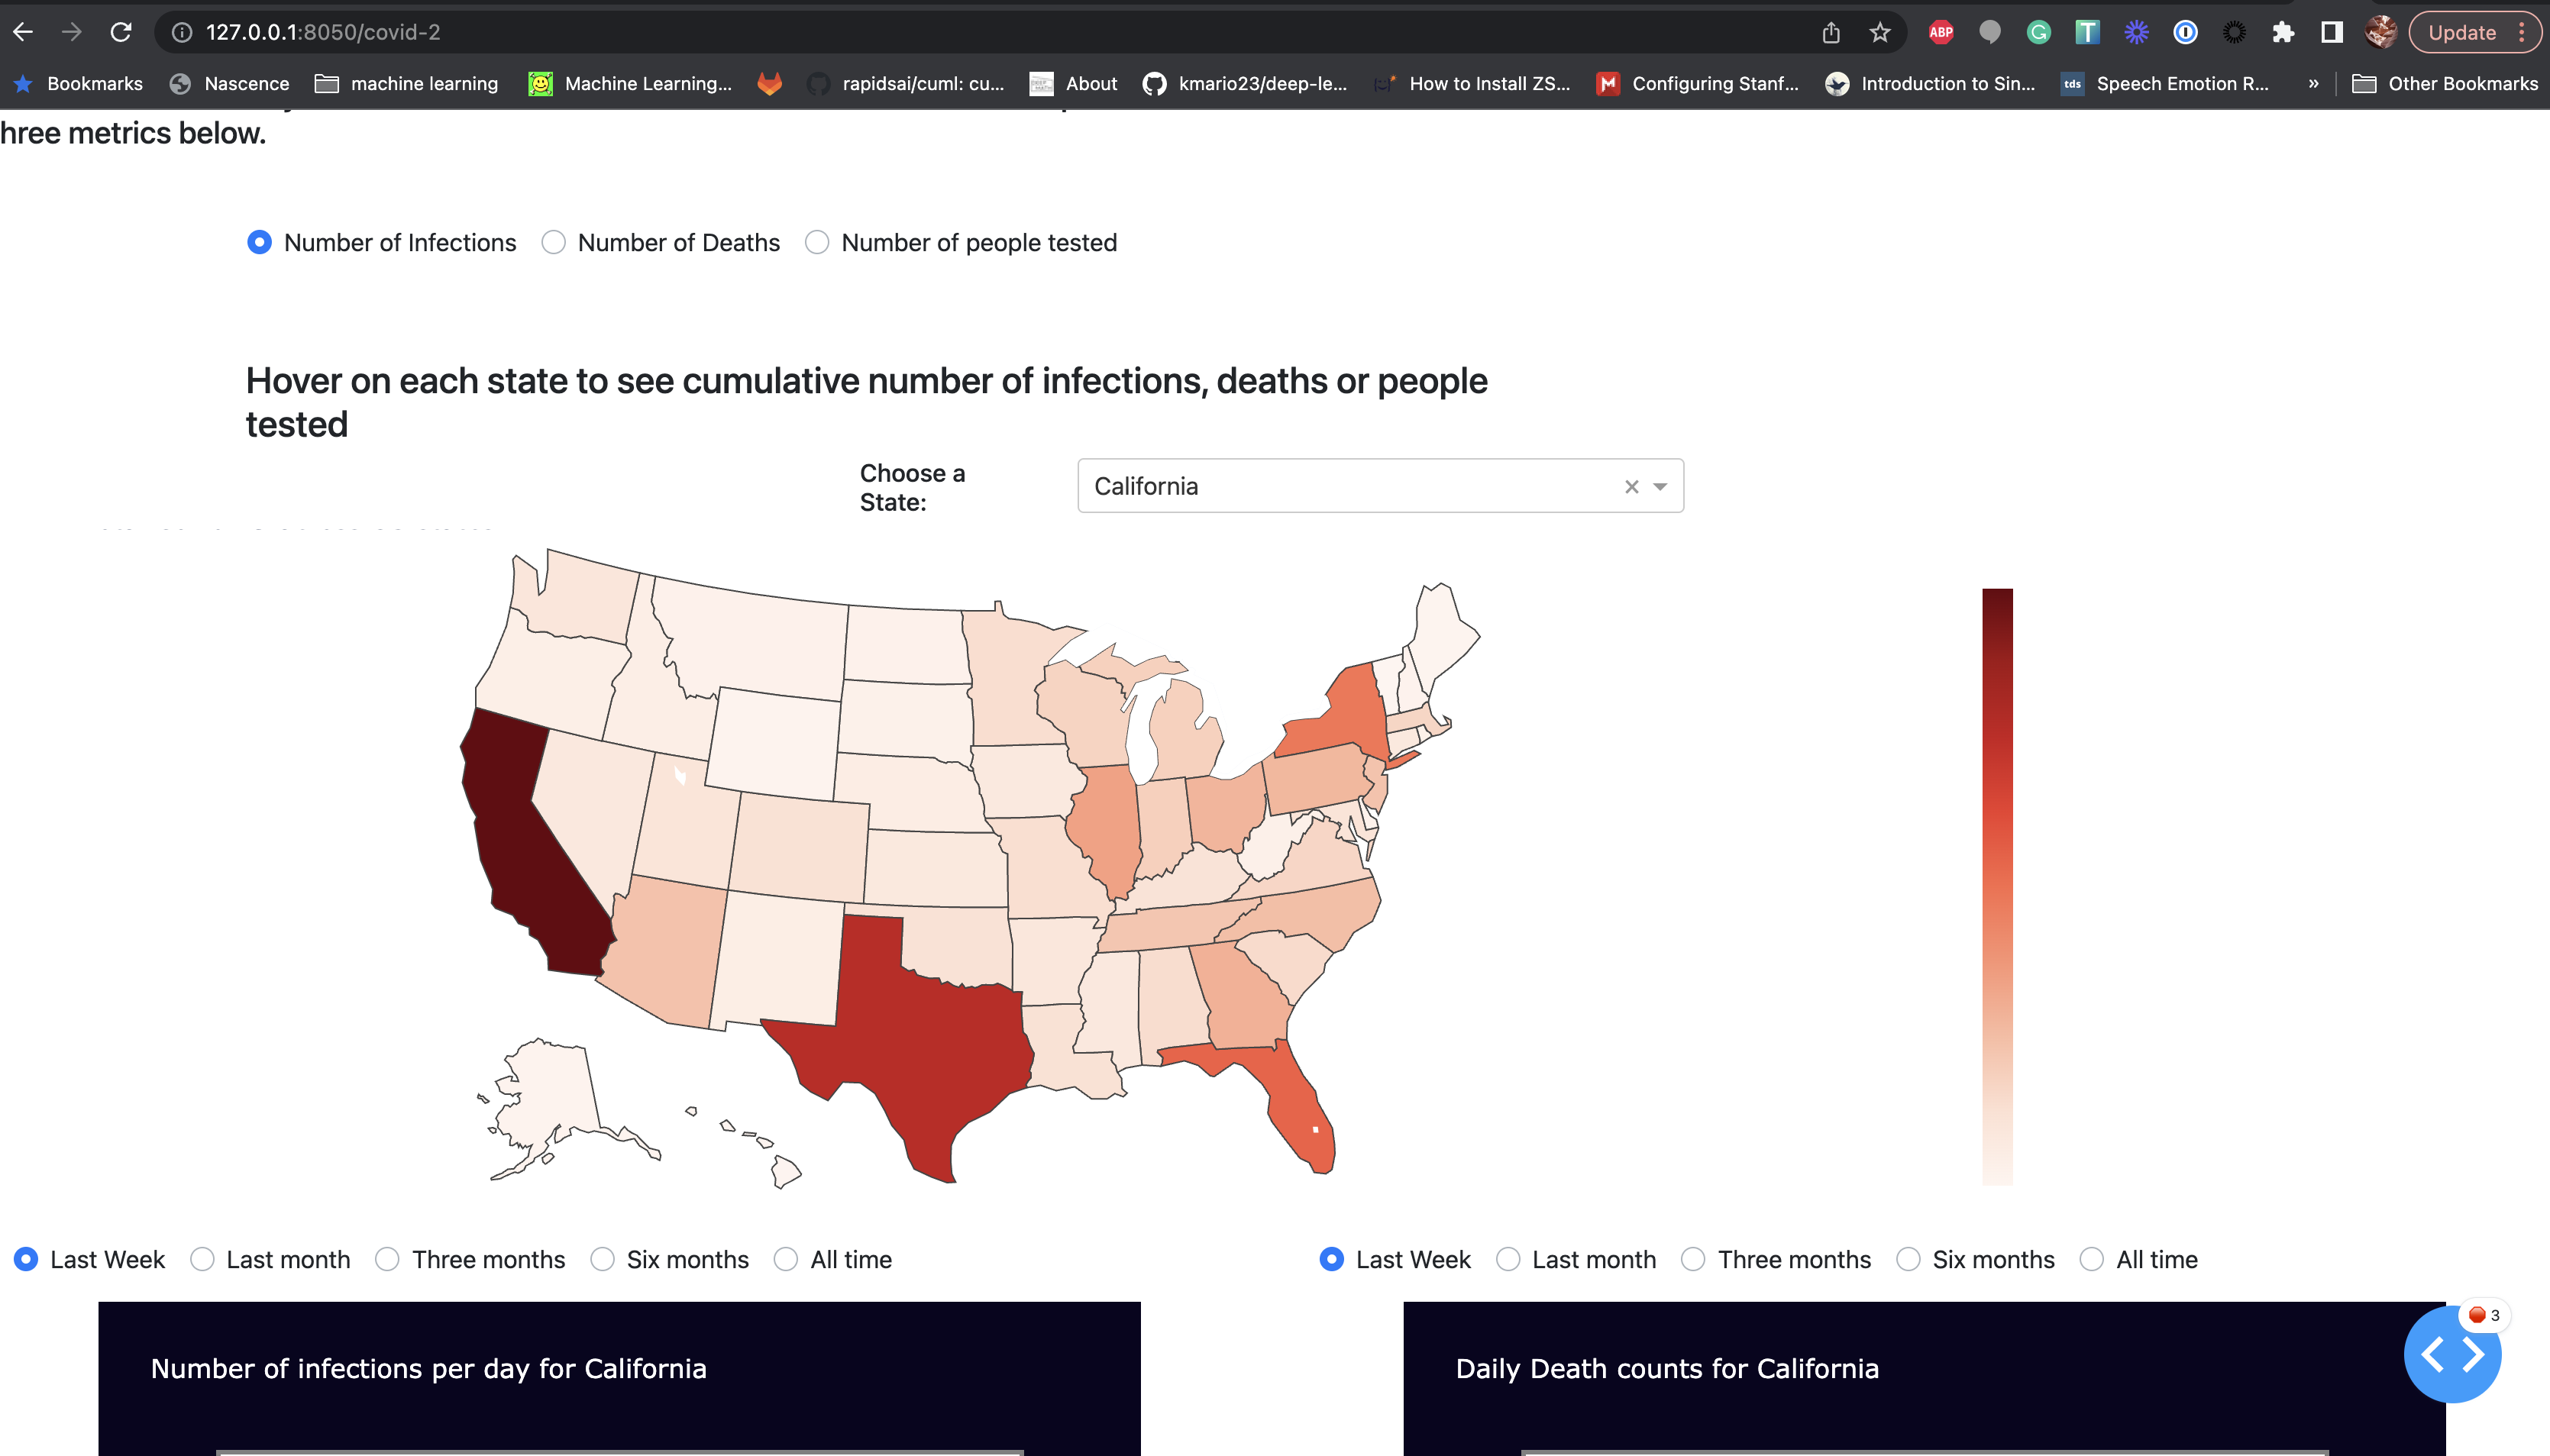
2) The second page contains a choropleth map of the US with the total number of infections, deaths and people tested. The total number of hospitalizations is rather an unreliable number hence I stayed away from adding that here.
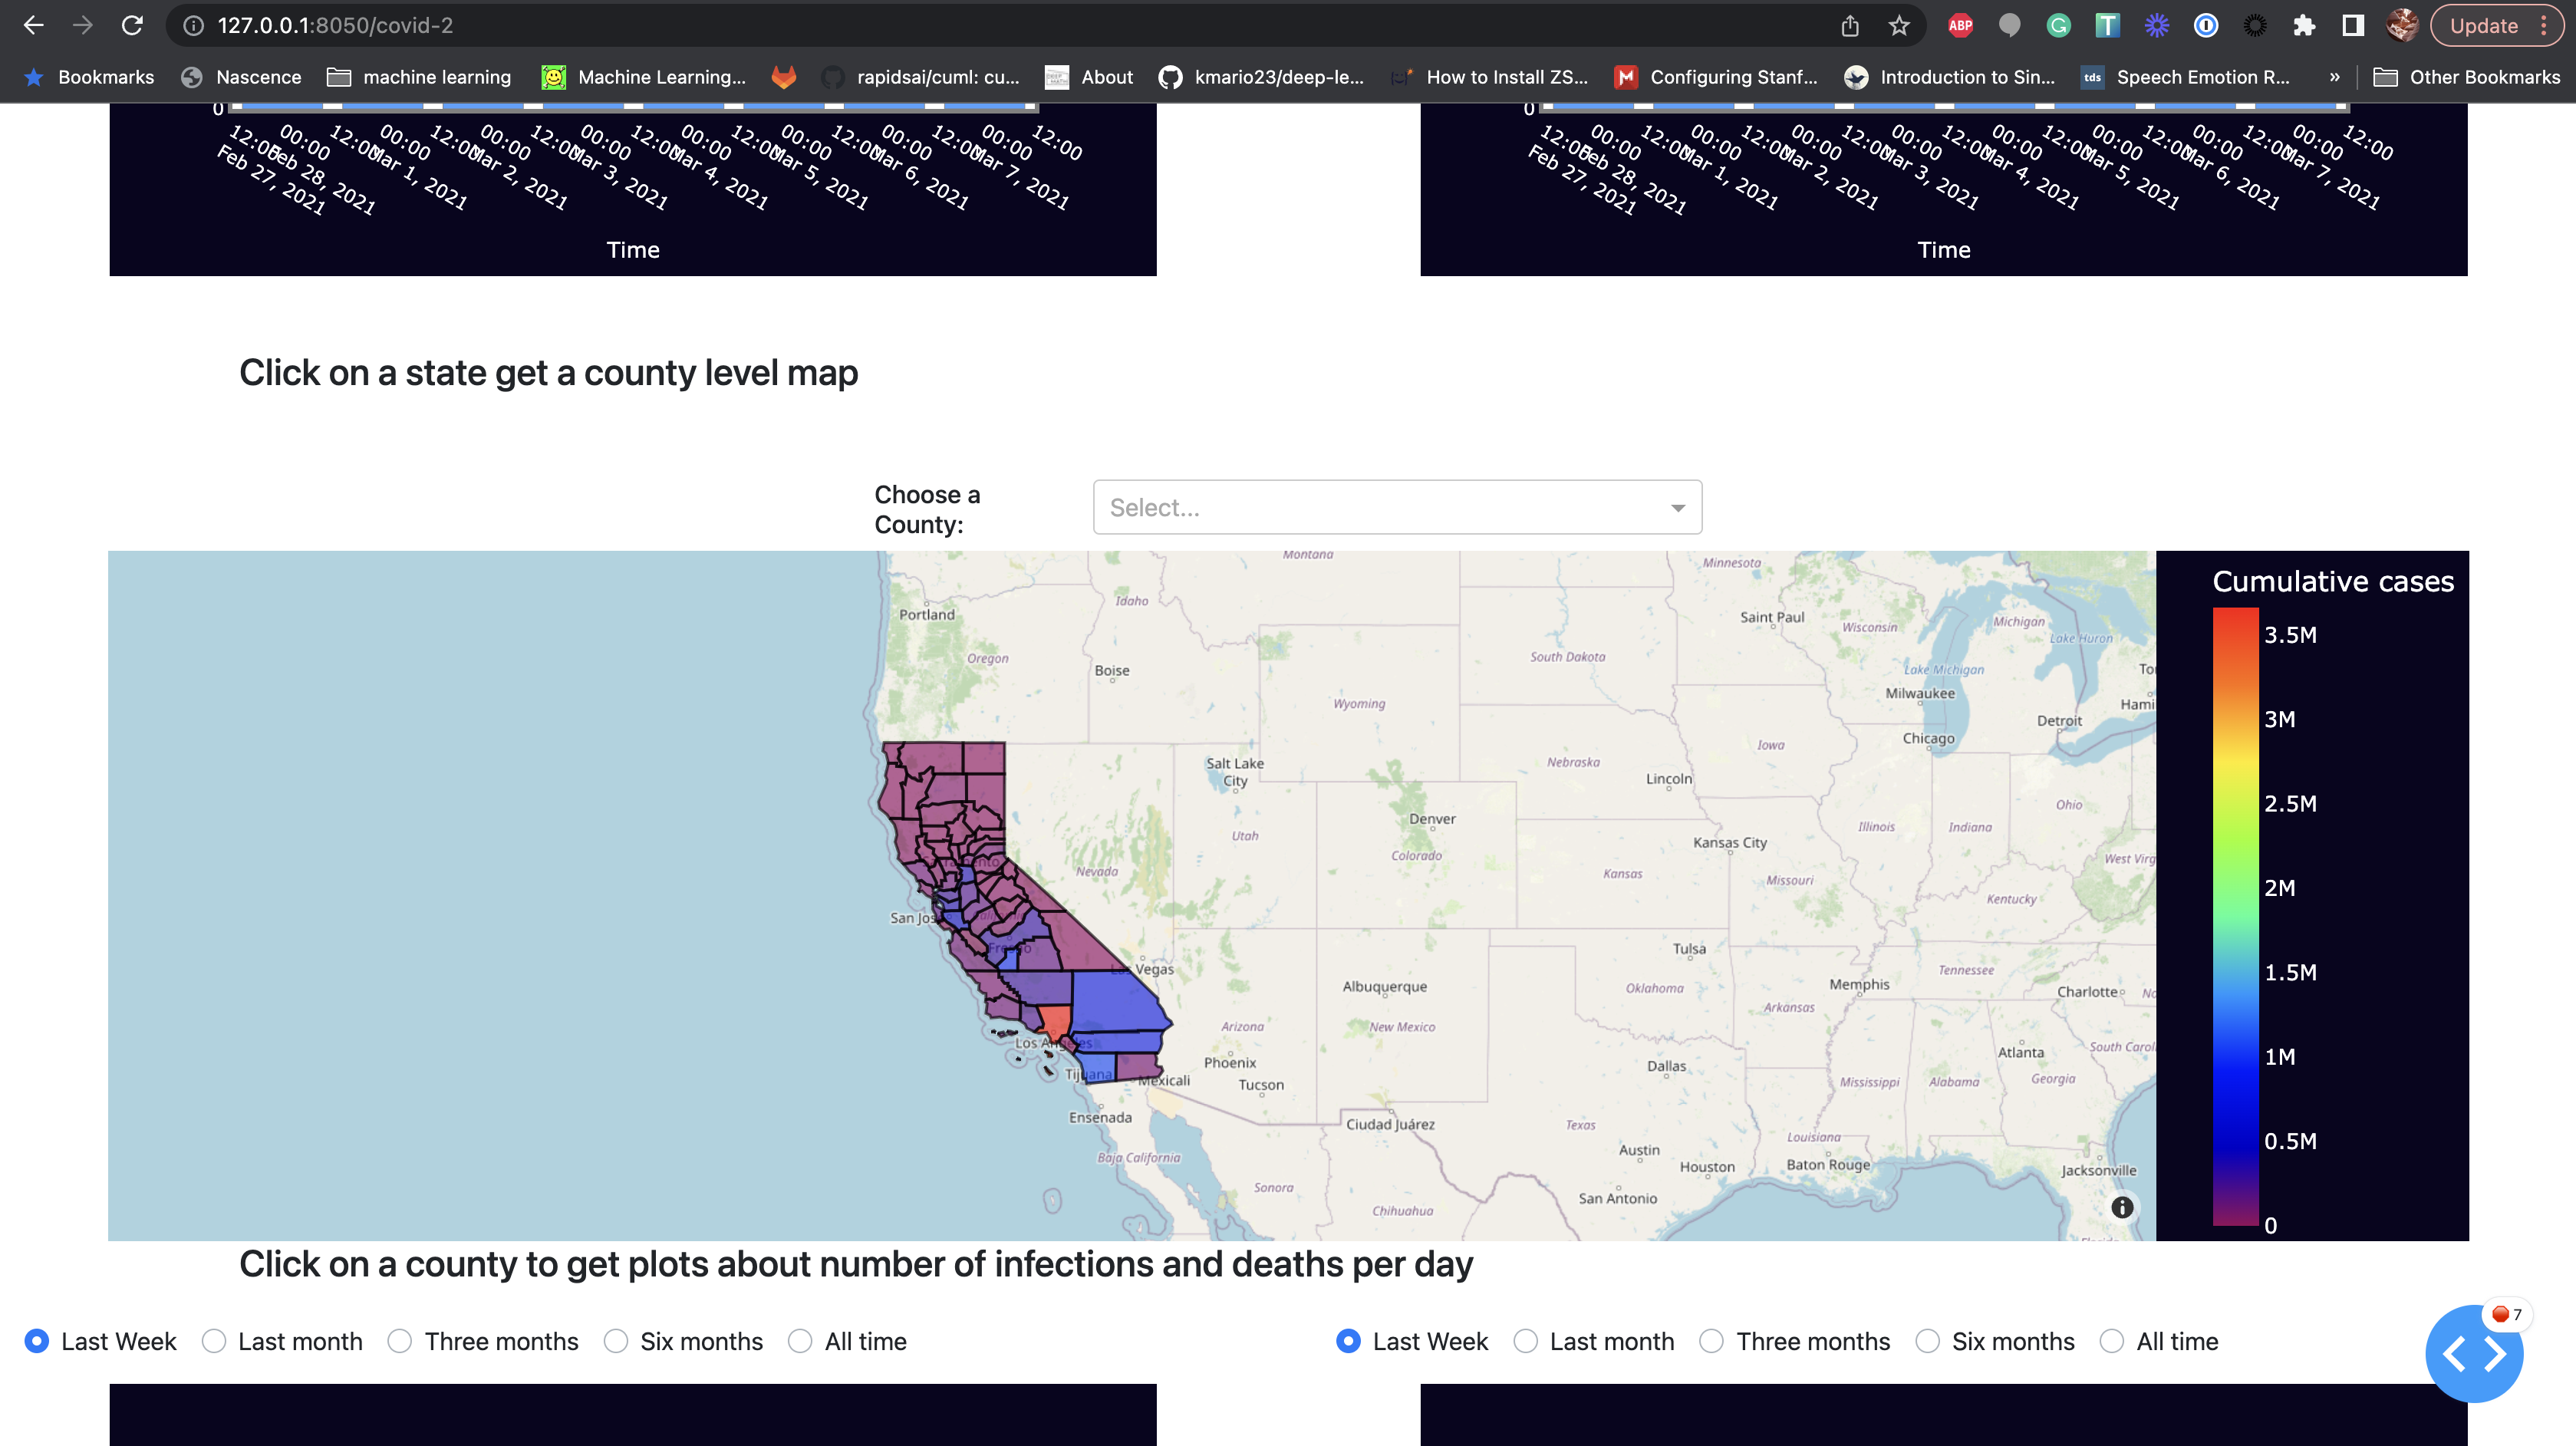
3) Clicking on any state will open up a another choropleth map of all the counties for that state. You can either use the dropdown or click on each county to see the total number of cases and deaths per county.